
QUICK ANSWER
A PEST analysis lists the outside forces that could change your business: political, economic, social, and technological. For a product two or three years out, do it in five steps. Set the year, let AI draft a long list with a source for every line, open every source yourself, sort what’s left by impact and certainty, then have AI turn the checked list into 10 insights ranked by importance, and make the top few into cards with a sign to watch and a decision made in advance. Expect most of AI’s first list to fail the source check. That’s normal, and it’s the most useful part of the exercise.
Where this sits on the map: Advanced planning track (Y+2 to Y+3) · Market and environment scan (PEST). See the advanced planning hub for the full track.
On this page
- What PEST is
- Why three years out changes the method
- Five steps with AI
- Copy-and-paste prompts: PEST draft and 10 ranked insights
- PEST analysis example (fictional)
- Limits
- FAQ
What PEST is
PEST stands for political, economic, social, and technological. It’s a checklist for looking outside your company, at the forces you don’t control but have to live with.
The idea is older than most people expect. The earliest known version is usually traced to Harvard Business School professor Francis Aguilar, whose 1967 book Scanning the Business Environment used the letters ETPS. Later writers reshuffled them into STEP, PEST, and longer versions like PESTLE, which adds legal and environmental (RapidBI).
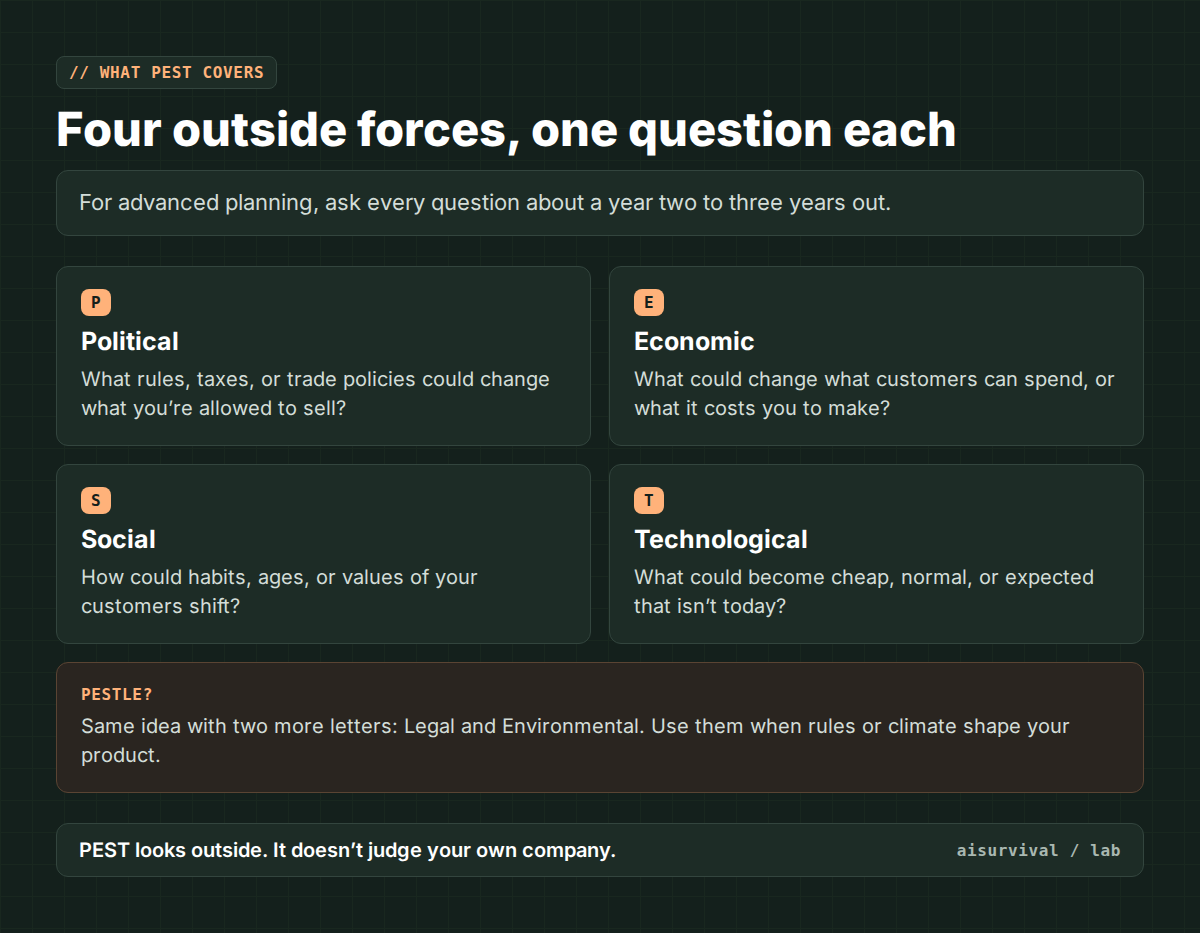
Which letters you use matters less than people argue about online. Pick the version that covers what actually moves your product. If packaging rules or climate shape what you sell, use PESTLE. If not, four letters is plenty.
Why three years out changes the method
Most PEST examples online describe today. That’s useful for a business plan, not for deciding what to build in 2029. A three-year scan has a different job: separate what’s already scheduled from what merely might happen.
A rule with an effective date is scheduled. A shift in how people shop is likely, maybe. A new technology getting cheap enough to matter is possible. Those three need different responses, and mixing them up is how plans go wrong. Treat a “possible” like a sure thing and you overbuild. Treat a scheduled change like a maybe and you get caught.
Five steps with AI
Step 1: Set the frame
Write one sentence: the product area, the market, and the year you’re planning for. “Reusable lunch boxes, sold online in the US, for 2029.” Without a year, AI drifts toward vague, timeless trends. Without a market, it mixes up countries.
Step 2: Let AI draft the long list
This is the part AI does well. Ask for eight factors per letter, each with a source link and a “scheduled, likely, or possible” label. You’ll get 30-plus lines in a minute, including some you’d never have thought of.
Use a chat that can search the web, if you have one. A model answering from memory can only give you sources it remembers, and it remembers some that never existed.
Step 3: Open every source
All of them. Check three things: the link opens, the page actually says what AI claimed, and the information isn’t years out of date. Anything that fails gets deleted or moved to a “hypothesis” list. It doesn’t go into the plan.
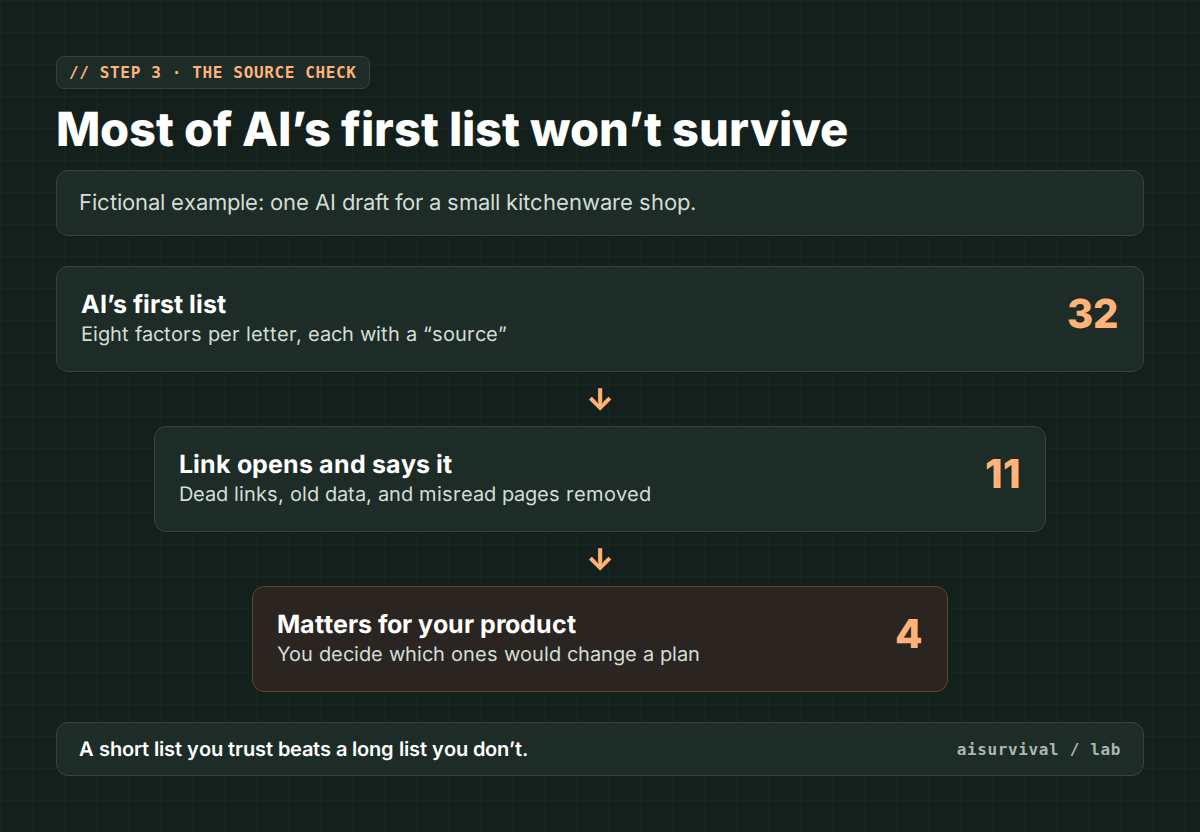
This step is slow and boring, and it’s the whole value of the exercise. A PEST list nobody checked looks exactly like one somebody did.
Step 4: Sort by impact and certainty
For each factor that survived, ask two questions. How much would this change our product if it happened? And how sure are we that it will? The answers put it in one of four boxes, and each box has a different job.
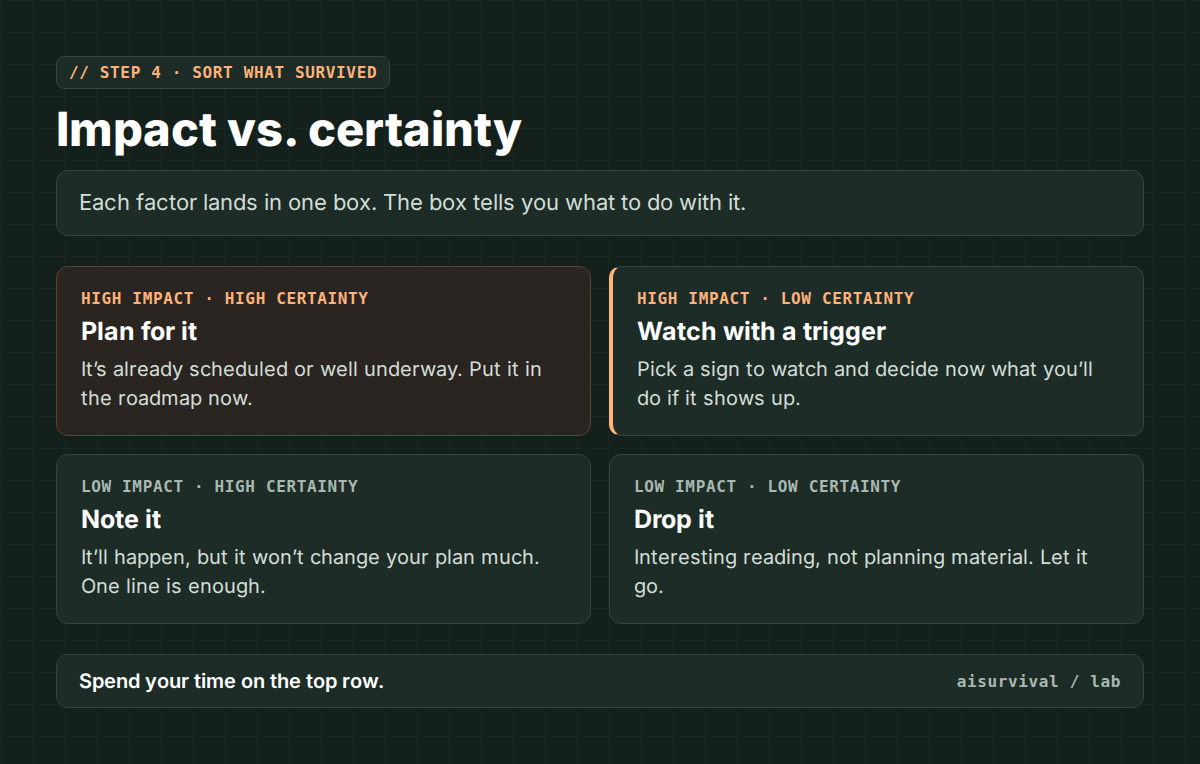
AI can draft this ranking for you. The second prompt below turns your checked list into 10 insights, ordered by importance. Treat that order as a first pass, though. AI only knows your margins, suppliers, and appetite for risk if you tell it, and even then the final call is yours.
Step 5: Turn the top row into cards
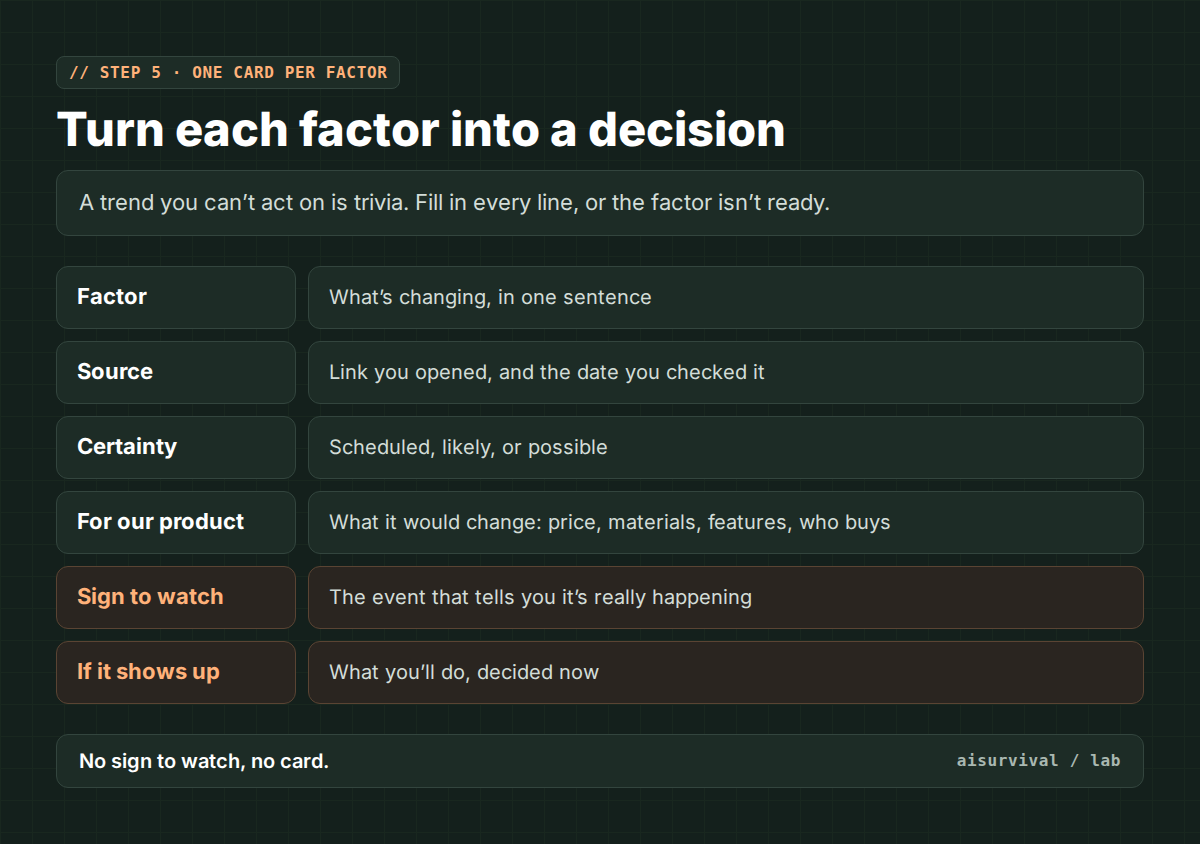
Every factor in the top row gets one card. The two lines people skip are the important ones: the sign you’ll watch for, and what you’ll do when it shows up. Decide that now, while nothing is urgent. A trend without a sign to watch is just reading material.
Large company: a planning team runs a full PESTLE as part of the yearly strategy cycle, with input from legal, purchasing, and regional teams.
Small seller: one afternoon a quarter, four letters, and no more than five cards. Put a reminder in your calendar to recheck the signs.
Copy-and-paste prompts: PEST draft and 10 ranked insights
A PEST table on its own is just a list. What you need for planning is the “so what”: which changes matter most for your product, and in what order. That takes two prompts, with your source check in between. To use them:
- Run Prompt 1 with your product area, market, and target year. Turn on web search if your AI chat has it.
- Check the sources. Paste the table into a spreadsheet, open every link, and mark each row yes or no.
- Open a new chat and run Prompt 2. Paste only the “yes” rows, plus a few lines about your business so the AI can judge impact.
- Read the 10 insights from the top. Each one says why it got its rank. Move any you disagree with.
- Make cards for your top three, as in step 5.
Tip: if an insight’s “Based on” line lists a factor you didn’t paste, delete that insight. It came from the AI’s imagination, not your checked list.
Prompt 1: Sourced PEST draft (fill in the brackets)
I am planning products for [year, e.g., 2029].
Product area: [e.g., reusable lunch boxes]
Market: [e.g., online sales in the US]

Make a PEST analysis as a table with these columns:
Letter | Factor (one sentence) | Certainty (SCHEDULED, LIKELY, or POSSIBLE) | Source link | What the source says (one short sentence)

Rules:
1. Give 8 factors each for Political, Economic, Social, and Technological.
2. SCHEDULED means there is a published date. Give the date.
3. Every row needs a source link. If you cannot find one, write NO SOURCE. Do not make up a link.
4. Do not include a number unless it appears on the source page.
5. Do not tell me what to do yet. Do not rank the factors.
Prompt 2: From checked PEST rows to 10 ranked insights (fill in the brackets)
I am planning products for [year].
Product area: [ ]
Market: [ ]

About my business, so you can judge impact:
- Price range: [ ]
- Biggest costs: [e.g., materials, shipping]
- Who buys: [ ]
- Main sales channel: [ ]
- What we do well: [ ]

Below are PEST factors I have checked myself. Every row has a source I opened.
[paste only the checked rows]

Turn these into 10 insights, ranked from most to least important.

An insight is not a restated factor. It says what one or more factors mean for my product. Combine factors when they point the same way.

For each insight, give:
1. Rank and a one-line headline
2. So what: what it means for my product, in two sentences
3. Based on: the rows it uses (copy the Letter and Factor text exactly)
4. Impact (1 to 5): how much it would change my product, sales, or costs
5. Certainty: SCHEDULED, LIKELY, or POSSIBLE (use the lowest certainty among its rows)
6. Why this rank: one sentence
7. Sign to watch: an event I can check, with a rough date
8. Suggested move: one small action for the next 90 days
9. Assumptions: anything you assumed about my business that I did not tell you

Ranking rule: higher impact first. If impact ties, SCHEDULED comes before LIKELY, and LIKELY before POSSIBLE. If that ties too, the earlier sign to watch comes first.

Rules:
- Use only the rows I pasted. Do not add new trends, numbers, or sources.
- If the rows only support fewer than 10 real insights, give fewer and say why. Do not pad the list.
- End with "Questions that would change this ranking": up to 3 things you need me to tell you.
PEST analysis example (fictional data)
Everything in this example is made up for illustration. The shop, the factors, the rule, and the numbers aren’t real. Don’t plan around them.
Fictional shop: the same two-person lunch box store from the lead user guide. Frame: reusable lunch boxes, sold online in the US, for 2029. AI’s first list had 32 rows. Eleven passed the source check. These four made the top row of the grid.
| Letter | Fictional factor | Certainty | Sign to watch | Decided now |
|---|---|---|---|---|
| P | A state rule requires recyclable packaging for online orders from 2028. | Scheduled | Final rule text published | Switch the box insert to paper by mid-2027. |
| E | Parcel shipping rates keep rising each year. | Likely | Shipping passes 15% of the average order | Test a lighter, flat-pack box. |
| S | More people batch cook for the whole week. | Likely | Repeat buyers ordering four or more containers | Move the stacking set concept to a concept test. |
| T | Temperature-tracking stickers get cheap enough for consumer products. | Possible | A supplier quote under $0.50 per sticker | Order samples. Nothing more until then. |
Prompt 2 turned those 11 checked rows into a ranked list. Here’s how the fictional top insight came back:
#1. Packaging and shipping costs are both moving against the current box. So what: the rule and rising shipping rates hit the same part of the product, the outer box. One redesign can answer both. Based on: P and E rows. Impact: 5. Certainty: likely (the shipping row is the weaker one). Sign to watch: final rule text, expected early 2027. Suggested move: get quotes for a paper, flat-pack box this quarter. Assumption: shipping is one of the shop’s two biggest costs.
Two factors, one decision. That’s what a good insight looks like, and it’s why the ranked list is more useful than the raw table. The shop still checked the assumption before acting on it.
The last column of the table is the point. None of those decisions is big, and that’s on purpose. A three-year scan rarely tells you to bet the shop. It tells you which small moves to make early, and which questions to keep asking.
Quick checklist:
☐ The frame names a product area, a market, and a year.
☐ Every row has a source someone actually opened.
☐ Every number appears on its source page.
☐ Scheduled, likely, and possible are kept apart.
☐ The 10 insights use only checked rows, and you reviewed the ranking.
☐ Each top insight has a sign to watch and a decision.
☐ There’s a date on the calendar to look again.
Limits
- PEST only looks outside. It says nothing about your strengths, your costs, or your competitors. Pair it with a 3C analysis for that.
- The four letters overlap. A new rule about materials is political, environmental, and economic at once. Put it wherever it’s easiest to act on.
- A scan goes stale fast. Recheck your signs at least every quarter.
- AI tends to repeat the trends that are most written about, which aren’t always the ones that matter for your niche.
- This guide is about planning, not legal advice. If a rule affects what you can sell, read the official text or ask someone qualified.
FAQ
What does PEST stand for?
Political, economic, social, and technological. They’re the four kinds of outside forces that can change a business.
What’s the difference between PEST and PESTLE?
PESTLE adds legal and environmental factors. Use it when regulations or climate have a big effect on your product.
Can I use ChatGPT or Claude for a PEST analysis?
Yes, for the first draft and for a first ranking. Ask for a source on every line, open each one yourself, then have AI rank only the rows that passed. Expect to delete a lot, and to move a few ranks yourself.
How often should I redo a PEST analysis?
A full redo once a year is common. Check the signs on your cards every quarter, and sooner if something big changes in your market.
Where this fits: Advanced planning track · Market and environment scan, part of the product planning process series. Previous guide in this track: researching customers you don’t have yet.
Next in this track: 3C analysis with AI, putting customers, competitors, and your own company on one page.
Your turn: Which letter is hardest to scan for your product: political, economic, social, or technological? Tell us in the comments. We’ll use the answers to pick the examples in future guides.