
QUICK ANSWER
TAM is everyone who could buy this kind of product. SAM is the part you can actually reach with your product, price, channel, and region. SOM is what you can realistically win in a set time. To get numbers that hold up, size the market two ways: top-down from a published total, and bottom-up from buyers you can count times price times how often they buy. Let AI draft both and list every assumption. Then check the sources and your weakest input yourself. If the two numbers land far apart, don’t average them. Find out why.
Where this sits on the map: Advanced planning track (Y+2 to Y+3) · Market sizing. See the advanced planning hub for the full track.
On this page
- TAM, SAM, and SOM in plain words
- Top-down vs. bottom-up
- Five steps with AI
- Copy-and-paste prompts: two-way sizing and assumption check
- Market sizing example (fictional)
- Limits
- FAQ
TAM, SAM, and SOM in plain words
Three layers, each one smaller than the last.
- TAM (total addressable market): everyone who could buy this kind of product, if nothing stood in the way.
- SAM (serviceable available market): the part of TAM your product can actually serve, given your price, channel, and region.
- SOM (serviceable obtainable market): the share of SAM you can realistically win in a set period, once you count competitors and your own capacity.
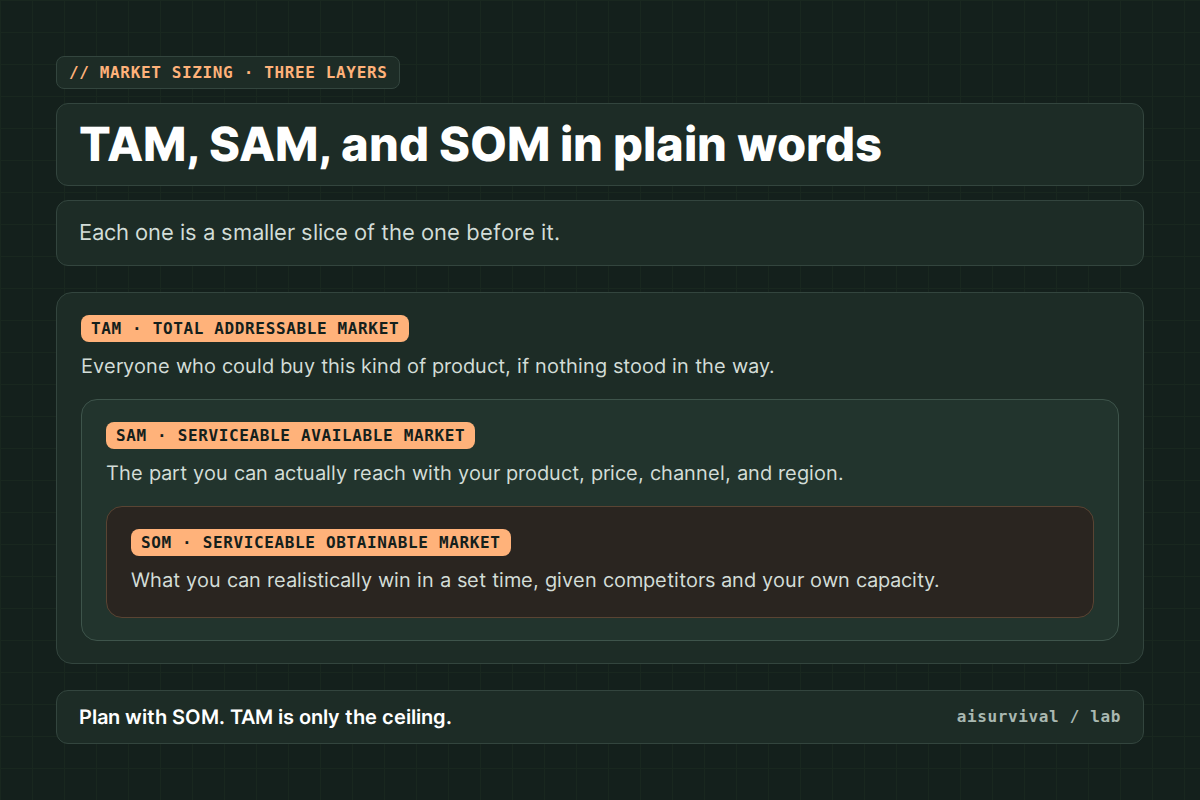
The mistake people make most often is planning with TAM. It’s a ceiling, not a forecast. Your sales plan, your inventory, and your hiring should come from SOM.
Top-down vs. bottom-up
There are two ways to get these numbers. Top-down starts with a published industry total and narrows it by region, segment, and channel. Bottom-up starts from buyers you can count and multiplies by price and how often they buy.
Top-down is quick, but it’s easy to inflate. A common warning in startup guides is the founder who grabs the biggest total available and works backward to make SAM and SOM fit (Launchrock). Bottom-up takes longer, but every input is something you can point to.
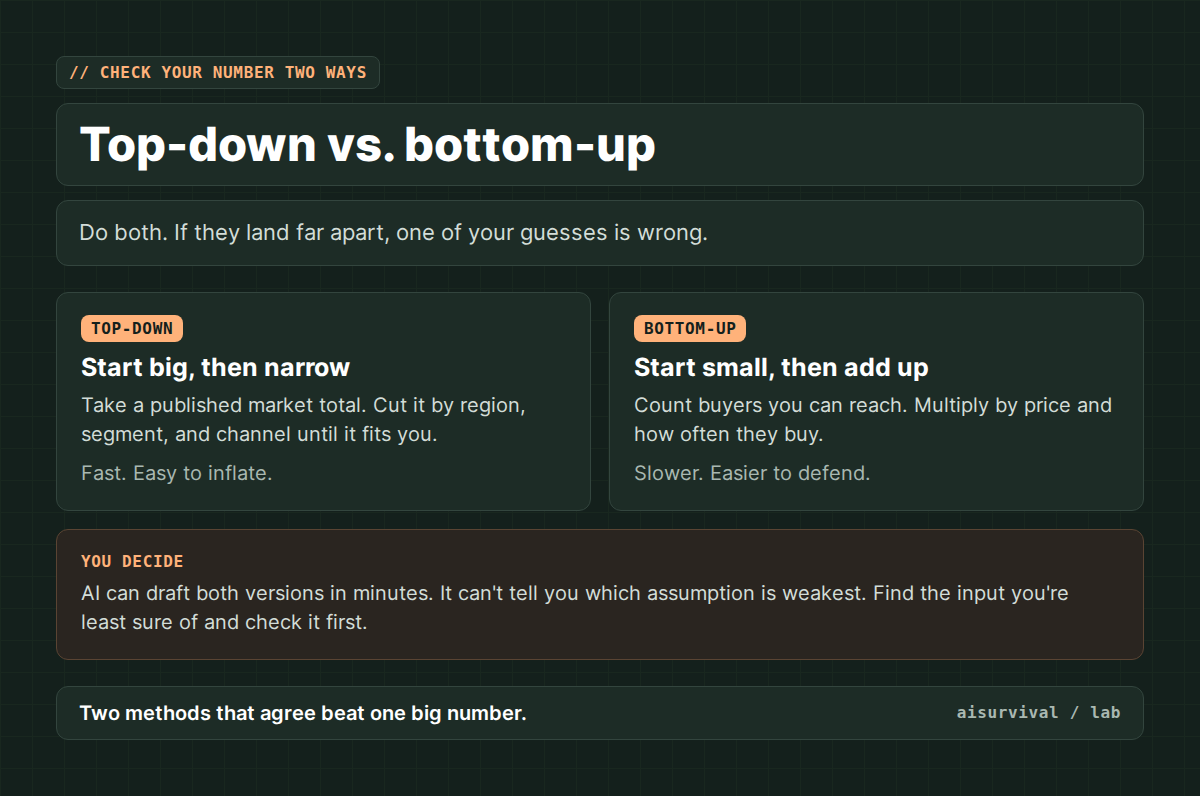
Do both. They rarely match. One market research firm notes the two methods often differ by a factor of three to ten, and treats the gap as something to explain, not to hide (Infomineo). Chasing down that gap is where you learn which assumption is weak.
Five steps with AI
Step 1: Define the buyer and the product
Start from the opening you found in your 3C analysis. Name who buys, what they buy, where, and for what year. A vague buyer gives you a vague number.
Step 2: Top-down with sources
Ask AI for published market totals, each with a link. Then open them. Check the year, the region, and above all the definition. A report on all food storage isn’t a report on reusable lunch boxes. If AI gives you a market size with no source you can open, delete it. Don’t keep it as a placeholder.
Step 3: Bottom-up from countable inputs
Build it from three inputs: how many buyers you can reach, your price, and how often they buy. Each input needs a source or a clear label that says ASSUMPTION. AI is useful here for laying out the math and finding public data, like census or trade association figures.
Step 4: Compare and find the weakest input
Put the two SAM numbers side by side. If they’re far apart, ask AI, in a new chat, which assumption would have to change to close the gap. Then check that one yourself. Usually it’s a definition problem in the top-down number or a buyer count that’s too generous in the bottom-up one.
Step 5: Set SOM by capacity, not by hope
SOM isn’t a percentage you pick because it sounds modest. Work it out from what you can actually make, ship, and market in the period. For a market that’s two to three years out, give three versions, low, base, and high, and write down what would have to be true for each.
Large company: a planning team buys research reports, builds both models in a spreadsheet, and gets finance to sign off on the assumptions.
Small seller: skip the paid reports. A bottom-up estimate on one page, with every assumption labeled, is enough to decide whether to test an idea.
Copy-and-paste prompts: two-way sizing and assumption check
Use two separate chats so the second one isn’t defending the first one’s work. To use them:
- Run Prompt 1 with your buyer, product, market, and year. Turn on web search if your AI chat has it.
- Open every source. Delete any number whose page doesn’t show it.
- Open a new chat and run Prompt 2 with the cleaned-up estimate.
- Check the top assumption it flags before you use the number anywhere.
Tip: if the bottom-up SOM is bigger than what you could physically ship, the capacity line is missing. Add it.
Prompt 1: TAM, SAM, and SOM two ways (fill in the brackets)
I am sizing a market for [year].
Buyer: [e.g., US households that batch cook weekly]
Product: [e.g., a stacking set of reusable lunch boxes]
Market: [e.g., online sales in the US]
Price: [ ]
How often a buyer buys: [e.g., once every 2 years]
What I can make and ship per year: [ ]

Estimate TAM, SAM, and SOM two ways.

A. TOP-DOWN: start from published market totals.
B. BOTTOM-UP: number of buyers I can reach x price x how often they buy.

For every number, give:
- The value and the math
- Source link, or the label ASSUMPTION
- What the source actually measures (its definition, year, and region)

Rules:
1. Do not make up a source or a number. If you cannot find one, say so.
2. Keep A and B separate. Do not adjust one to match the other.
3. SOM must not be bigger than what I can make and ship.
4. End with a table comparing A and B for SAM and SOM, and list the 3 assumptions you are least sure of.
Prompt 2: Stress-test the estimate (new chat)
Below is a market size estimate someone else made. Act as a skeptical investor.

[paste the cleaned-up estimate, with sources and assumptions]

1. Rank every assumption from weakest to strongest. Say why in one sentence each.
2. For the top 3, say how the SOM would change if the assumption were half as big, and twice as big.
3. If the top-down and bottom-up numbers differ a lot, name the most likely reason.
4. Suggest one cheap way to check the weakest assumption in the real world.

Do not add new numbers or sources. Only judge what is here.
Market sizing example (fictional data)
Every number here is made up for illustration. Don’t use them for a real plan.
Fictional shop: the two-person lunch box store from the 3C guide. Opening: a stacking week set for batch cooks, sold online in the US, for 2029, at $40, bought about once every two years.
| Layer | Fictional number | How it was built |
|---|---|---|
| TAM | $500M a year | Top-down: a made-up report on reusable lunch containers in the US. |
| SAM (bottom-up) | $40M a year | 2,000,000 reachable batch-cook households × $40 ÷ 2 years. |
| SAM (top-down) | $120M a year | The report total, narrowed to online sales. |
| SOM | $200,000 a year | Capacity: the shop can ship about 5,000 sets a year × $40. |
The two SAM numbers are three times apart. Prompt 2 pointed at the report’s definition, and that’s where the problem was: the made-up report counted every reusable food container, not just lunch boxes. The shop kept the bottom-up $40M and labeled the household count as its weakest input.
Is $200,000 a year worth it? That’s not a math question. For a two-person shop it might be plenty. For a big brand it’s a rounding error. The number just makes the decision honest.
Quick checklist:
☐ The buyer, product, market, and year are named.
☐ Every number has a source you opened, or says ASSUMPTION.
☐ You checked what each report actually measures.
☐ Top-down and bottom-up were built separately.
☐ You know why they differ.
☐ SOM fits what you can make and ship.
Limits
- AI will sometimes quote market sizes from reports that don’t exist, or from real reports with the wrong numbers. Never use a figure you haven’t seen on the source page.
- Market reports use different definitions. Two reports on the same market can disagree a lot, and neither is necessarily wrong.
- For a market that doesn’t exist yet, every number is a scenario. Treat it that way.
- Market size says how big the prize could be, not whether you’ll win it. Pair it with a concept test.
FAQ
What’s the difference between TAM, SAM, and SOM?
TAM is the whole market, SAM is the part you can reach, and SOM is the part you can realistically win in a set time.
Should I use top-down or bottom-up market sizing?
Both. Bottom-up is easier to defend, and top-down is a useful sanity check. If they’re far apart, figure out why before you use either.
Can AI calculate market size for me?
It can do the math and find public data fast. It can’t vouch for its own numbers. Ask for a source on every figure and open each one.
How do I size a market that doesn’t exist yet?
Build it bottom-up from a buyer you can describe today, then make low, base, and high versions. Write down what would have to be true for each.
Where this fits: Advanced planning track · Market sizing, part of the product planning process series. Previous guide in this track: 3C analysis with AI.
Next in this track: future customer personas and the value proposition canvas. Subscribe if you’d like it in your inbox.
Your turn: Which input is hardest to pin down for your product: buyers, price, or how often they buy? Tell us in the comments. We’ll use the answers to shape future guides.