
QUICK ANSWER
Pick the method by the job. To turn a paragraph into a diagram, use a text-to-visual tool like Napkin. For a full poster-style infographic, start from an AI template in Canva, Piktochart, or Venngage. For exact control over every word and color, ask a chatbot to write the image as SVG or HTML code. For real data, make the chart in a spreadsheet. Use AI image generators only for mood, never for numbers. Whatever you use, write the words first and check every word and number before you publish.
Series: Side Hustle, AI tools by job, part 1. Prices and free plan limits were checked on November 1, 2026. No affiliate links in this post.
On this page
- Pick by the job, not the tool
- The 7 ways
- What the free plans won’t give you
- A workflow that works with any tool
- Copy-and-paste prompt: infographic as code
- Six checks before you publish
- Limits
- FAQ
Pick by the job, not the tool
“Infographic” covers very different things. A three-step diagram for a blog post, a one-page poster for Pinterest, and a bar chart of last month’s sales need different tools. Most bad results come from using a poster tool for a chart, or an image generator for anything with words in it.
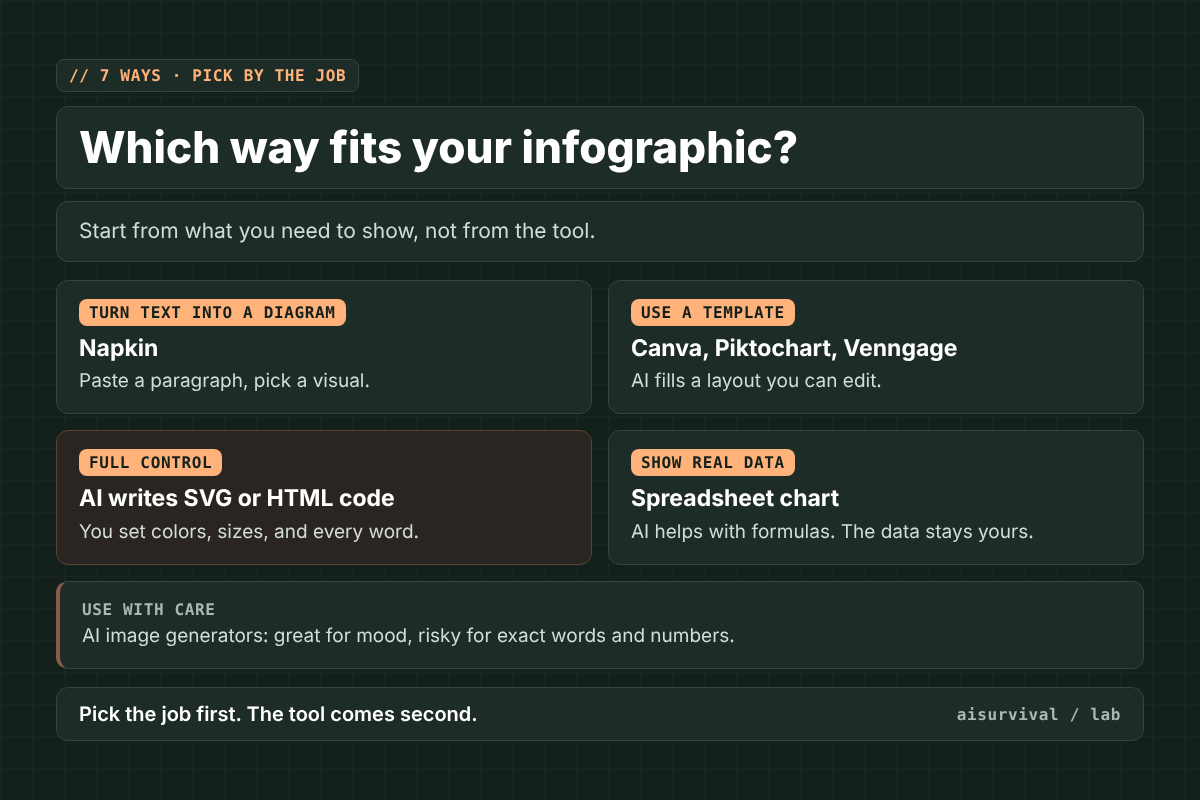
The 7 ways
1. Turn text into a diagram with Napkin
Paste a paragraph, select it, and Napkin suggests diagrams: flows, comparisons, cycles. It’s the quickest way to turn an explanation you’ve already written into a visual. Best for: process and concept diagrams inside a blog post. Watch for: it only knows what’s in your text, so vague writing gives you vague diagrams.
2. Start from a Canva template
Canva has a huge template library and AI features that can draft a design from a prompt. You still swap in your own words and numbers. Best for: social graphics and Pinterest pins where the layout matters more than precision. Watch for: popular templates are, well, popular. Change the layout enough that yours doesn’t look like everyone else’s.
3. Generate a full infographic with Piktochart AI
Type a topic and Piktochart’s AI builds a complete, editable infographic. Best for: a fast first draft of a long, poster-style piece. Watch for: the free plan allows only two PNG downloads in total, so treat it as a trial.
4. Use Venngage’s AI for reports and timelines
Venngage leans toward business visuals: reports, timelines, process charts. Its AI drafts a design from a prompt. Best for: work-style graphics that need to look tidy. Watch for: free designs carry a watermark, according to a pricing summary from Toolradar.
5. Ask a chatbot to write the infographic as code
Any AI chatbot can write an infographic as SVG or HTML, which you then open in a browser and save as an image. It sounds technical, but you don’t have to read the code. You just describe what you want and ask for changes in plain words. Every image on this blog is made this way. Best for: exact wording, a consistent style across many posts, and no watermarks. Watch for: you need a way to turn the code into a PNG, like a screenshot, and you have to check the layout on a phone.
6. Make data charts in a spreadsheet
If the infographic is really a chart, make it where the data lives. Google Sheets and Excel both build clean charts, and an AI chatbot can write any formula you’re stuck on. Best for: sales, traffic, or survey results. Watch for: don’t paste customer data into a public AI tool. Ask for the formula with made-up column names instead.
7. Use an AI image generator, carefully
Image generators can make a striking background or illustration. But they draw words as pictures, so letters and numbers can come out wrong. Best for: a mood image behind your real text. Watch for: never let one write your data. Put the words on top in another tool.
What the free plans won’t give you
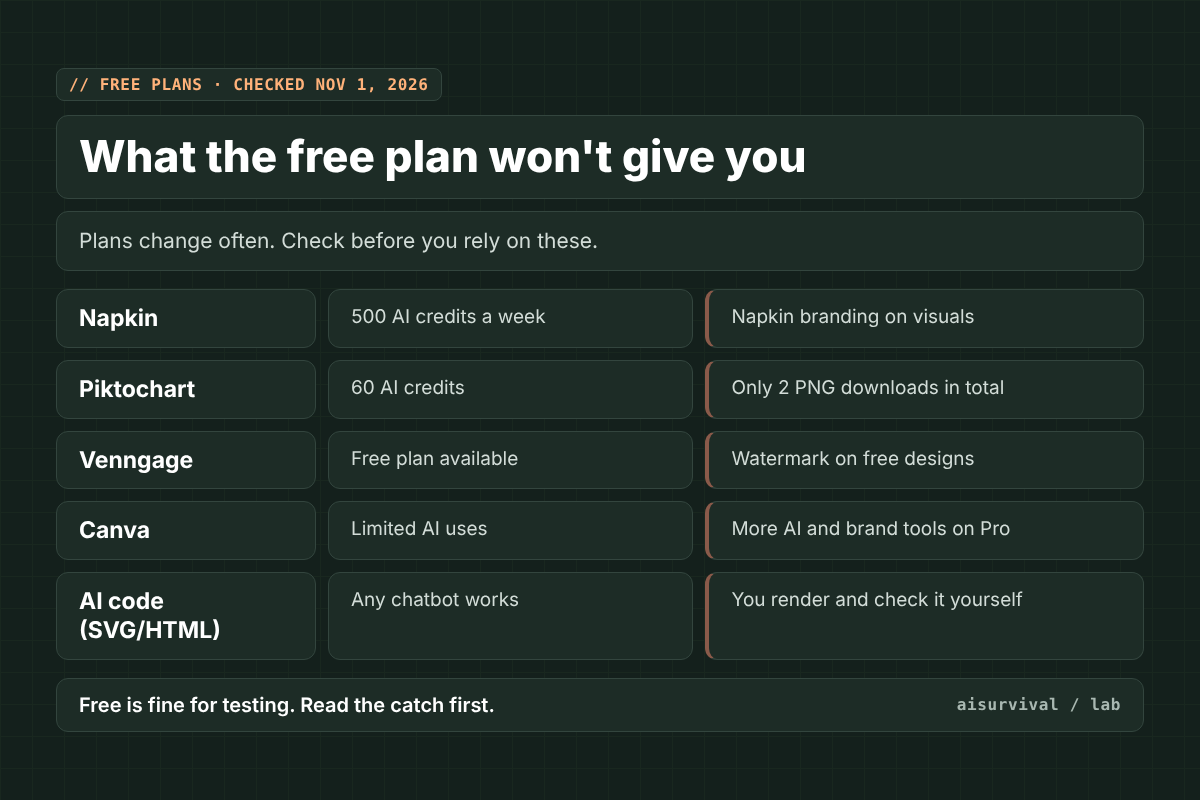
| Tool | Free plan | Cheapest paid plan | Source |
|---|---|---|---|
| Napkin | 500 AI credits a week, unlimited PNG and PDF exports, Napkin branding on visuals | Plus, $9 per month (10,000 credits, branding removed, SVG export) | Napkin pricing |
| Piktochart | 60 AI credits, 2 PNG downloads in total | Pro, $10 per month billed yearly or $15 monthly | Piktochart pricing |
| Venngage | Limited designs, watermark | Premium, listed at $19 per month | Toolradar summary |
| Canva | Templates plus a limited number of AI uses | Pro (price varies by region) | PricingSaaS change log |
These plans change often. Canva’s free AI allowance alone changed more than once in 2026. Check the official pricing page on the day you sign up.
A workflow that works with any tool
Most bad infographics are a writing problem, not a design problem. If you can’t say what the image answers in one sentence, no tool will fix it.
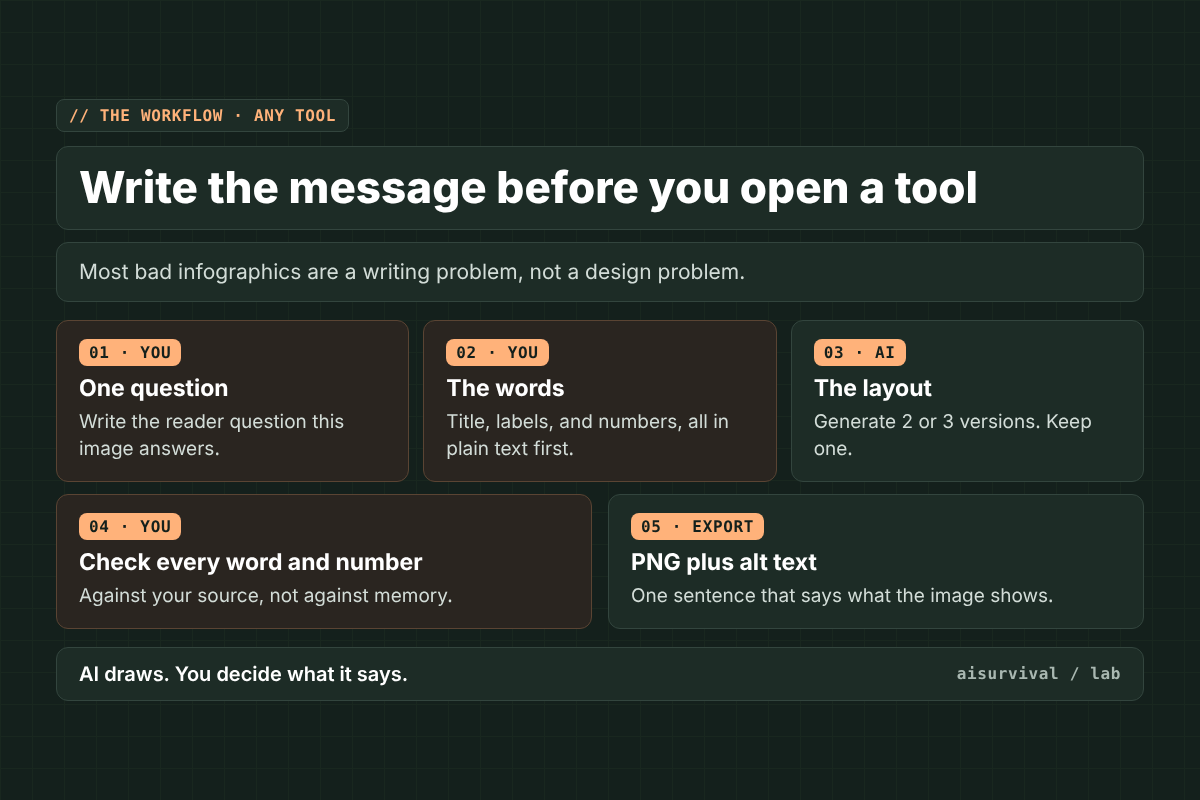
- Write the reader’s question. “Which tool should I use?” or “What do the free plans leave out?” One question per image.
- Write every word in plain text. Title, labels, numbers. Short enough to read on a phone.
- Let AI do the layout. Ask for two or three versions and keep one.
- Check against your source. Not against memory. AI tools sometimes “tidy” a number.
- Export a PNG and write alt text. One sentence that says what the image shows.
Small seller: one tool is enough. Pick the one that matches the infographic you make most often.
Team at work: check your company’s rules on which AI tools are approved before you paste anything in.
Copy-and-paste prompt: infographic as code
This is method 5. Paste it into any AI chatbot, open the file it gives you in a browser, and take a screenshot. Ask for changes in plain words until it looks right.
Prompt: Build an infographic as one HTML file (fill in the brackets)
Make an infographic as a single HTML file with inline CSS.

Reader question it answers: [e.g., Which AI tool fits which infographic job?]
Title: [ ]
Content (use these words exactly, do not add or change facts):
[paste your labels, short sentences, and numbers]

Design rules:
- Size: 1200 x 800 pixels.
- Equal empty margin on all four sides: 56 px.
- Colors: background [ ], text [ ], one accent color [ ].
- Font: a clean sans-serif. Body text at least 20 px.
- Put text on solid panels. No images or icons from the web.

After the code, list every word and number you used so I can check them against my content.
Tip: once you like one image, keep the design rules and reuse them. That’s how a whole blog gets a consistent look.
Six checks before you publish
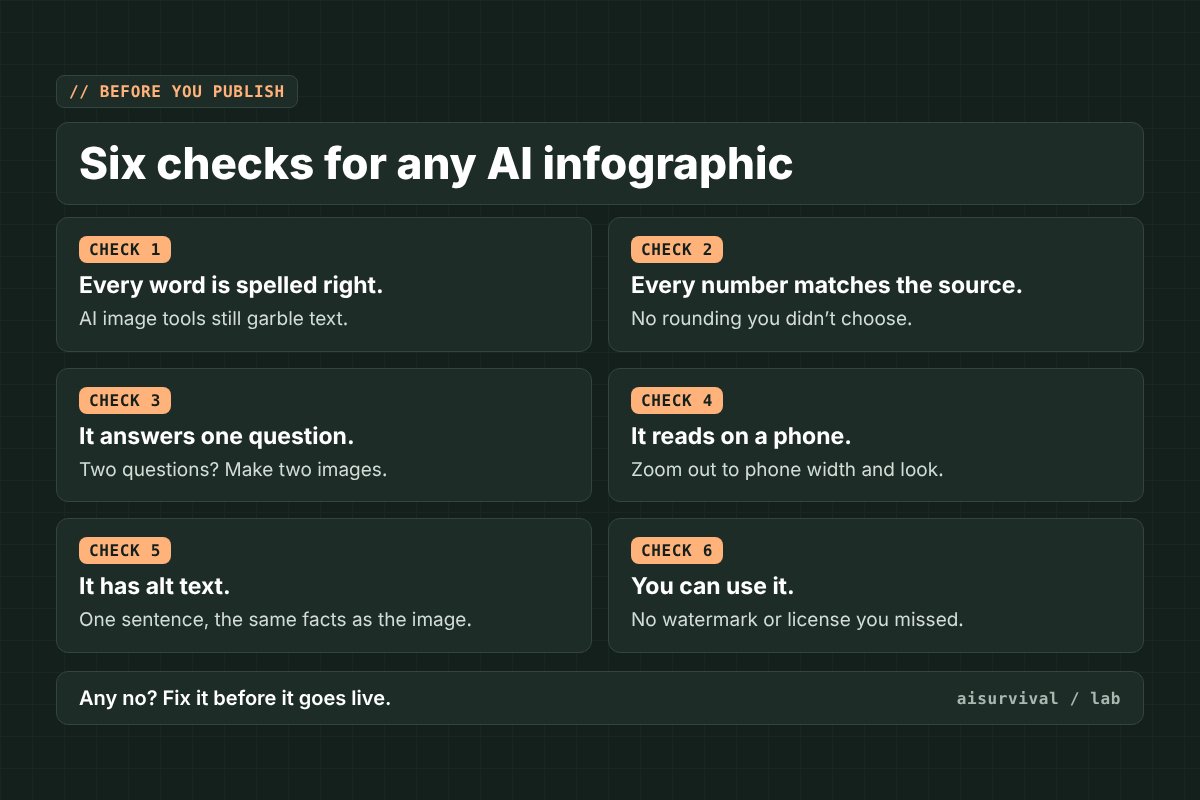
The last one is easy to forget. If you plan to sell something that uses the image, like a printable or a template, read the tool’s license terms for commercial use first.
Limits
- This is a comparison of what each tool offers, based on official pages and pricing summaries. It isn’t a hands-on benchmark.
- Prices and free limits were checked on November 1, 2026, and change often. The Venngage and Canva rows use third-party summaries because the official pages couldn’t be read that day.
- AI can make an infographic fast. It can’t decide what’s worth showing. That part is still yours.
FAQ
Can AI make an infographic for free?
Yes. Napkin, Piktochart, Venngage, and Canva all have free plans, each with limits like credits, downloads, or watermarks. Asking a chatbot to write the infographic as code also works on free chatbot plans.
What is the best AI infographic tool?
It depends on the job. Napkin is quickest for turning text into a diagram, template tools are best for poster-style designs, and AI-written code gives you the most control.
Can ChatGPT make infographics?
It can generate an image, but words and numbers in generated images can come out wrong. For accurate text, ask it to write the infographic as HTML or SVG code instead.
Can I sell products that use AI-made infographics?
Often yes, but it depends on each tool’s license and the marketplace’s rules. Read both before you list anything.
Where this fits: Side Hustle series, part of AI tools by job. Before you pick tools, score your idea with the five-question side hustle check.
Next in this series: how to turn a blog post into Pinterest pins with AI. Subscribe if you’d like it in your inbox.
Your turn: What kind of infographic do you make most: diagrams, posters, or charts? Tell us in the comments. We’ll use the answers to shape future guides.